

I have spent a good chunk of this year going back and forth between chart platforms, and TrendSpider is one I keep returning to, mostly out of curiosity about how much it has changed. The version people reviewed even two years ago barely resembles what you get today. The pricing structure was rebuilt, an AI layer was bolted on that actually does something useful, and a lot of the old complaints about missing broker connections just do not apply anymore.
So this is not a rehash of an old review with the year changed. This is what TrendSpider looks like right now, what it costs, where it earns its price tag, and where it still frustrates people.
What TrendSpider Actually Is
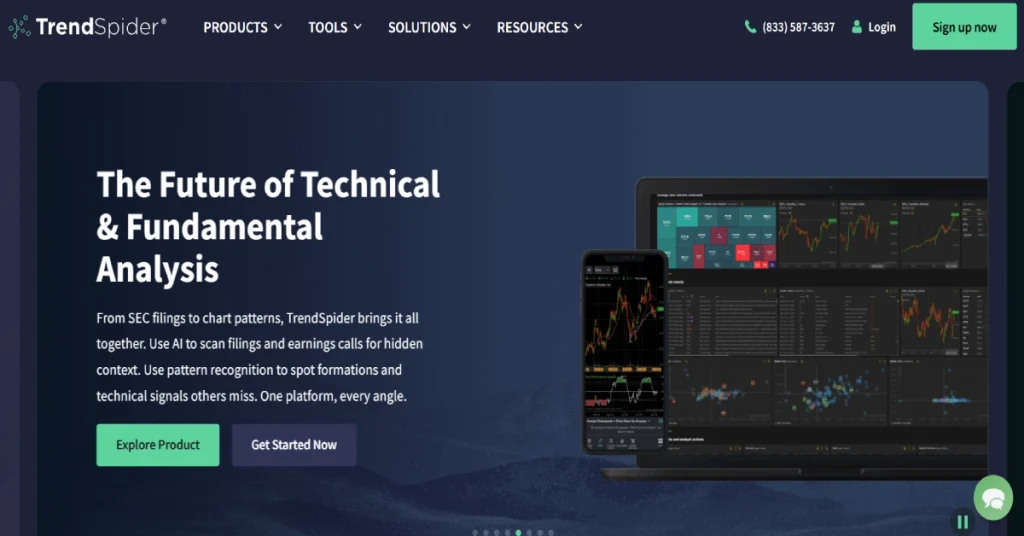
TrendSpider is a cloud based charting and market research platform built for traders who want their analysis automated instead of drawn by hand. You open a chart, and instead of manually plotting trendlines or support and resistance zones, the software draws them for you, across multiple timeframes at once if you want.
It is not just a charting tool though. There is a scanner that can search thousands of assets using plain language, a no-code backtesting engine, alert automation, and trading bots that can act on signals without you sitting in front of the screen all day. Add in fundamentals, insider activity, dark pool data, and even options flow, and you start to see why people call it dense. It genuinely tries to be a full research desk in one browser tab.
The Features That Actually Matter
Automated Trendlines And Pattern Detection
This is still the feature TrendSpider is best known for, and for good reason. The platform can draw trendlines, Fibonacci levels, and chart patterns automatically, and it does this across several timeframes at the same time. I have used tools that claim similar things and mostly just slap a basic indicator on top and call it AI. This one actually catches levels I would have missed scrolling through a chart manually, especially on the higher timeframes I tend to ignore.
Raindrop Charts
This one is unique to TrendSpider as far as I know. It is a chart type that shows volume distribution at each price level inside a candle, rather than just as a bar underneath it. It takes a bit of getting used to, but once it clicks, it becomes a genuinely useful way to spot where real buying or selling pressure sat during a session.
The Scanner
Honestly, this might be the most underrated part of the whole platform. You can build a scan using natural language, schedule it to run automatically, and pull from a list of over 700 pre-built Smart Watch Lists if you do not want to start from scratch. How granular your scans can be depends on your plan though. Standard users are capped at two hour intervals, while Enhanced and above can scan down to one minute.
Sidekick AI
Sidekick is the part that changed the most recently. It used to feel like a chatbot bolted onto the side of the platform for marketing purposes, and honestly that criticism was fair a year or two ago. Now it can read the chart you have open, annotate it, write custom JavaScript indicators from a plain English description, build scans, and manage watchlists. It still is not going to make trading decisions for you, and it should not, but as a research assistant that saves you from digging through menus, it earns its keep.
Backtesting And Strategy Bots
The Strategy Tester lets you build and test a trading idea visually, no coding required. What trips people up is that backtest depth is measured in candles, not years, and that number changes a lot by plan. Standard gives you 2,000 candles, Premium 10,000, Enhanced 20,000, and Advanced goes up to 30,000. If you are testing an intraday strategy on one-minute data, that difference matters a lot more than it sounds like on paper, because you will burn through 2,000 one-minute candles in a couple of trading days.
Alternative Data And Options
Beyond the charts, TrendSpider layers in corporate fundamentals, insider trading activity, dark pool and ATS volume, and even government trading disclosures, all viewable directly on your charts instead of a separate tab. As of March this year, real time US options data through OPRA was added as well, including an options chain view and a heatmap style Greeks and open interest map. That one is a paid add-on though, not included in the base plans.
READ MORE: What Is Print Management Software? How to Choose (2026)
How You Actually Use It, Step By Step
If you are brand new to the platform, here is roughly what the first stretch looks like.
Step 1: Pick a plan and start the trial. There is no free tier. Even the 14-day trial requires payment upfront, starting around $19 depending on which plan you choose to trial.
Step 2: Build your first workspace. You will set up chart layouts, add the indicators or auto-detected trendlines you want visible, and connect any watchlists you plan to track.
Step 3: Set up a scan. Instead of hunting through charts manually, describe what you are looking for in plain language and let the scanner pull matching tickers from the market or from one of the pre-built Smart Watch Lists.
Step 4: Build and backtest a strategy. Use the Strategy Tester to lay out entry and exit rules visually, then run it against historical data to see how it would have performed, within your plan’s candle limit.
Step 5: Automate alerts or bots. Once you trust a setup, you can let TrendSpider watch for it automatically and either alert you or, if you want to go further, connect it to a Strategy Bot.
Step 6: Connect a broker if you want live execution. Paper trading is available for free through the trading widget, so you can test the full workflow without risking money before deciding whether to connect a real account.
Budget two to four weeks before you feel like you actually know your way around. That is not just my experience either. It is the single most consistent complaint across other reviews too, and it is less about the software being clunky and more about how much it actually does.
Pricing Broken Down Plan By Plan
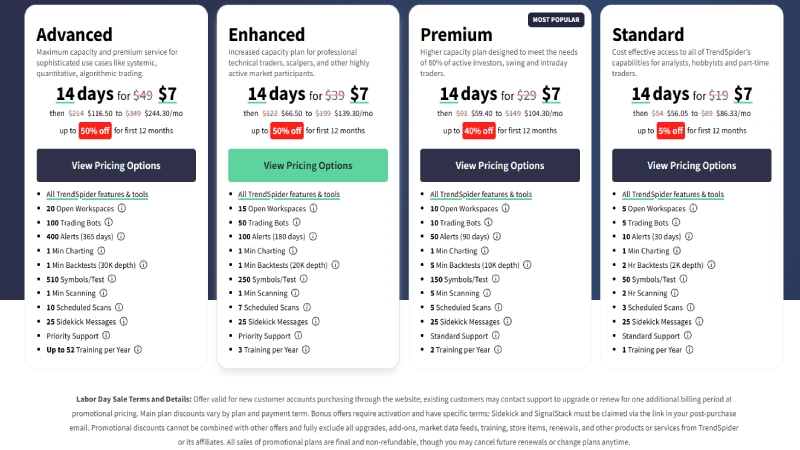
TrendSpider runs four individual tiers plus a Business plan for teams. Every single tier, including Standard, unlocks the full feature set and the same market data. What actually changes as you move up is capacity, meaning workspaces, active bots, alerts, and how far back your backtests can run.
Standard sits around $54 to $89 a month depending on billing cycle and whatever promotion is running. You get 5 workspaces, a smaller number of trading bots and alerts, scanning limited to two hour intervals, and backtests capped at 2,000 candles. This is aimed at people who check in on their trading occasionally rather than actively during the day.
Premium is the plan most people land on, priced around $91 to $149 a month. Workspaces go up to 10, alerts and bots increase noticeably, and backtest depth jumps to 10,000 candles.
Enhanced runs roughly $122 to $199 a month. This is where scanning drops to one-minute granularity, workspaces go up to 15, and you get up to 50 trading bots and 100 alerts, each lasting up to 180 days. If your style involves shorter timeframes or scalping, this is usually the floor.
Advanced tops out the individual plans at around $214 to $349 a month. You get 20 workspaces, up to 100 bots, 400 alerts lasting a full year, and the deepest backtest limit at 30,000 candles.
Business starts at $399 a month and is built for teams rather than individual traders.
One thing worth knowing: annual billing is meaningfully cheaper than paying monthly, usually somewhere in the 25 to 35 percent range, and TrendSpider runs near-constant promotions, so the price you see on any given day might not be the price you see next week. Always check the current pricing page before assuming a number from a review, mine included, is still accurate.
What I Liked
- The automated trendline and pattern detection genuinely outperforms most tools that claim to do the same thing
- The scanner is deep and flexible, and scheduling scans to run automatically saves real time
- Sidekick AI has actually become useful instead of feeling like a marketing add-on
- Every plan includes the full feature set, so you are not missing core tools on the cheaper tiers
- Broker integration and live order routing now work, which used to be a real gap
- Paper trading lets you test the entire workflow before risking money
What I Did Not Like
- It is genuinely expensive, and the sticker price is not the whole story once you factor in add-ons like the options data layer
- There is a real learning curve, most people need two to four weeks before feeling comfortable
- Backtest depth is measured in candles rather than time, which quietly limits how useful the lower tiers are for intraday testing
- The interface can feel cluttered once you stack multiple overlays, alerts, and data layers on one chart
- No free plan, and even the trial costs money
- Customer service reviews are mixed, some users report slow responses despite the platform offering phone, email, and chat support
Who This Actually Makes Sense For
If you are a systematic trader who wants rules tested before risking money, or someone who trades across multiple timeframes and gets tired of manually redrawing the same trendlines every session, TrendSpider earns its cost. It is also a genuinely strong fit if you trade options now that the OPRA data layer is built in, or if you manage several watchlists and want scanning to run in the background instead of babysitting charts all day.
If you are newer to trading, trade casually, or mostly want a clean charting tool without the extra layers, the price and the learning curve are both going to feel like a lot. TradingView’s mainstream tiers cost less for a broader but shallower feature set, and might make more sense until you know exactly which of TrendSpider’s tools you would actually use.
TrendSpider Versus TradingView
This comparison comes up constantly, so it is worth addressing directly. TradingView is cheaper, has a much larger community, and is arguably more intuitive for someone just getting started. But its automation and AI-driven analysis tools do not go nearly as deep as TrendSpider’s. TrendSpider’s scanner, automated technical analysis, and no-code backtesting are built for people who want the software doing the heavy lifting, not just displaying data nicely.
The honest answer is that a lot of active traders end up paying for both, using TradingView for quick chart checks and community ideas, and TrendSpider for the deeper automated work. Whether that is worth double the subscription cost depends entirely on how much of TrendSpider you actually use.
My Honest Verdict
TrendSpider in 2026 is a genuinely different platform than the one people wrote about a couple of years back, and mostly for the better. The core promise, automating the technical analysis grunt work, holds up under real use. Sidekick AI stopped being a gimmick. Broker integration closed a gap that used to be the platform’s biggest weakness.
None of that makes it cheap, and none of it erases the learning curve. If you cannot name three specific things you would actually use it for, you are probably better off starting with the trial before committing to a full year. But if you already know your workflow involves scanning, automated pattern detection, and strategy testing, this is one of the more complete tools built for that job right now.
Frequently Asked Questions
Does TrendSpider have a free plan?
No. There is no free tier, and even the 14-day trial requires payment upfront, typically starting around $19 depending on the plan.
What is the cheapest way to use TrendSpider?
Standard on annual billing is the lowest cost individual plan, generally landing around $54 a month, though the exact number shifts with current promotions.
Is Sidekick AI worth using?
If you use it for what it is built for, reading charts, writing custom indicators, and building scans from plain language, most users find it saves real time. It is not designed to make trading decisions for you.
How long does it take to learn TrendSpider?
Most users report needing two to four weeks before they feel comfortable with the platform’s full toolset. It is a genuinely deep platform, not a quick five-minute onboarding.
Can I backtest intraday strategies on TrendSpider?
Yes, but backtest depth is limited by candles rather than a fixed date range, so lower tiers run out of history quickly if you are testing on one-minute data. Higher tiers give you significantly more room.
Does TrendSpider support live trading through a broker?
Yes. Live order routing works through the Trading Widget and SignalStack, connecting to supported brokers and exchanges. Paper trading is available for free if you want to test the workflow first.
Is TrendSpider better than TradingView?
They serve different needs. TradingView is cheaper and broader for general charting and community ideas. TrendSpider goes deeper on automation, scanning, and no-code backtesting, at a higher price.
Disclaimer: This review is for informational purposes only and is not financial advice. Pricing and features change often, so confirm current details on TrendSpider’s official pricing page before subscribing.
